

Ticket Sales Analysis
Track ticket sales, best-selling shows, and more.


This ticket sales analysis dashboard provides a detailed breakdown of key data sets. With this dashboard, we can answer the following questions:
- Firstly, what are our total sales numbers?
- Secondly, how do ticket sales break down by show? By date?
- Lastly, which box offices sell the most tickets?
Track Sales Details
With this dashboard, viewers can analyze detailed aspects of the ticket sales process. For example, with the two card widgets, we can quickly see how many tickets were sold before and after a show began running. This data is especially useful as it could offer insight into which shows are most affected by pre-sale advertising and hype and which shows gain larger audiences after opening as public opinion spreads.
Also, with the ticket box doughnut chart, we can see where the most tickets are sold. With this data, leaders can ensure that resources and staff are allocated appropriately. Further, they could consider whether additional advertising might be helpful if some boxes suffer from low sales. Meanwhile, the dashboard’s bar chart displays the best-selling shows, allowing viewers to easily track the city’s most popular musicals.
With the dashboard’s line graph, viewers can see how many tickets were sold for each show each day. Line graphs are particularly useful for tracking trends that may occur over time as leaders can track data across days, weeks, months, or years.
Finally, the grid provides a straightforward list of the number of tickets sold for each show each day. This widget is especially useful as it is easily searchable with the text boxes at the top of each column.
Filter Your Data
One key feature of this dashboard is its versatility. With the three drop-down list box filters, viewers can display data for any combination of date ranges, show start dates, and shows. Users can reset the filters by clicking the funnel-shaped icons in the upper right corners of the list boxes. This feature is invaluable for users who need to focus their analysis on specific pieces of data.
Access live 30-minute demo with our experts
Sales Dashboard Examples

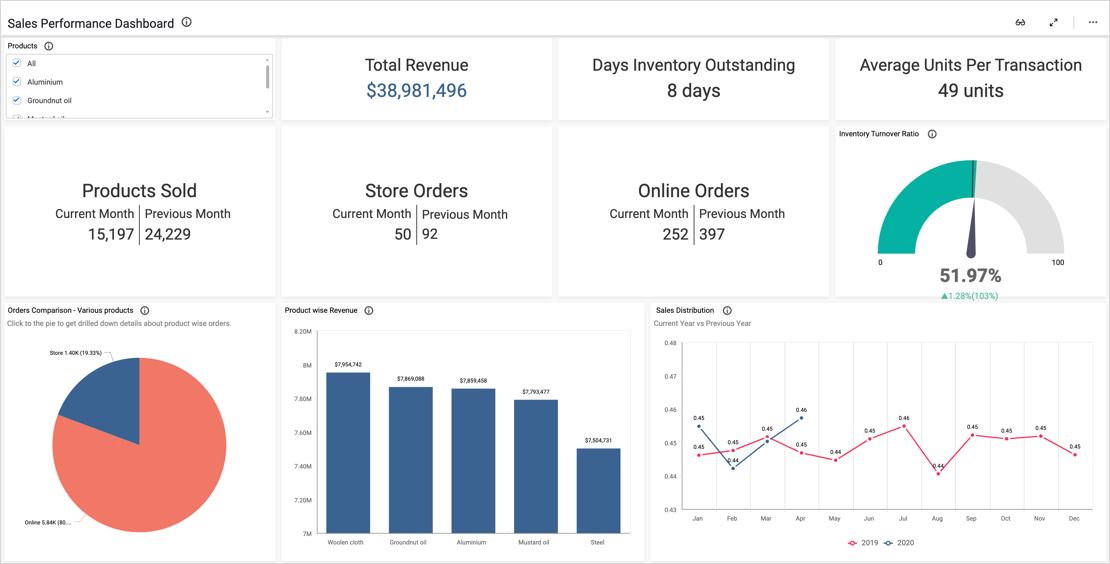
Smart Dashboard’s sales performance dashboard provides a detailed breakdown of key data sets.

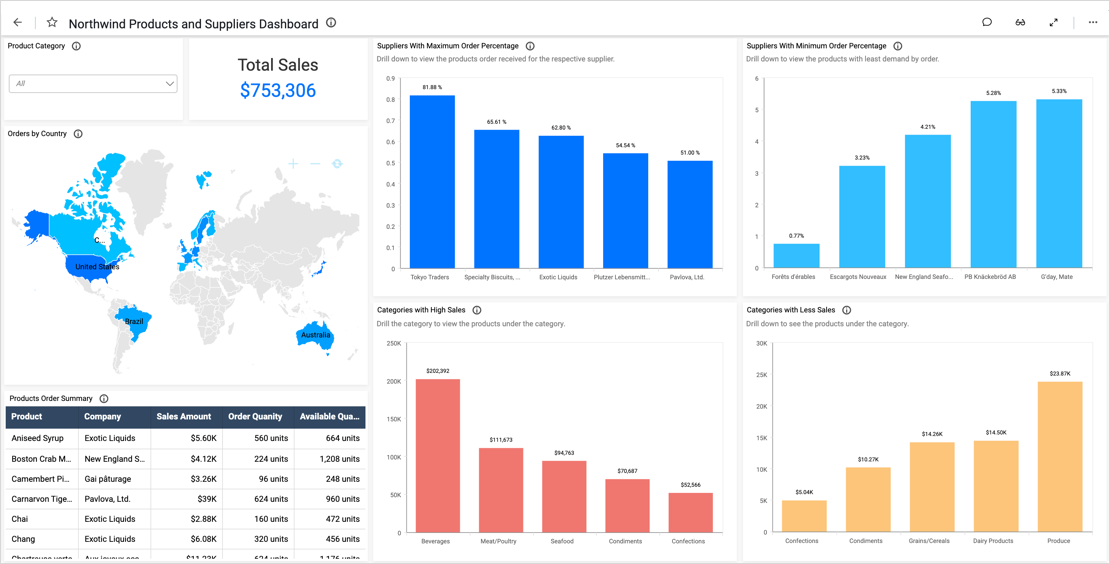
This sales dashboard lists orders placed with the fictitious supply company Northwind Traders.


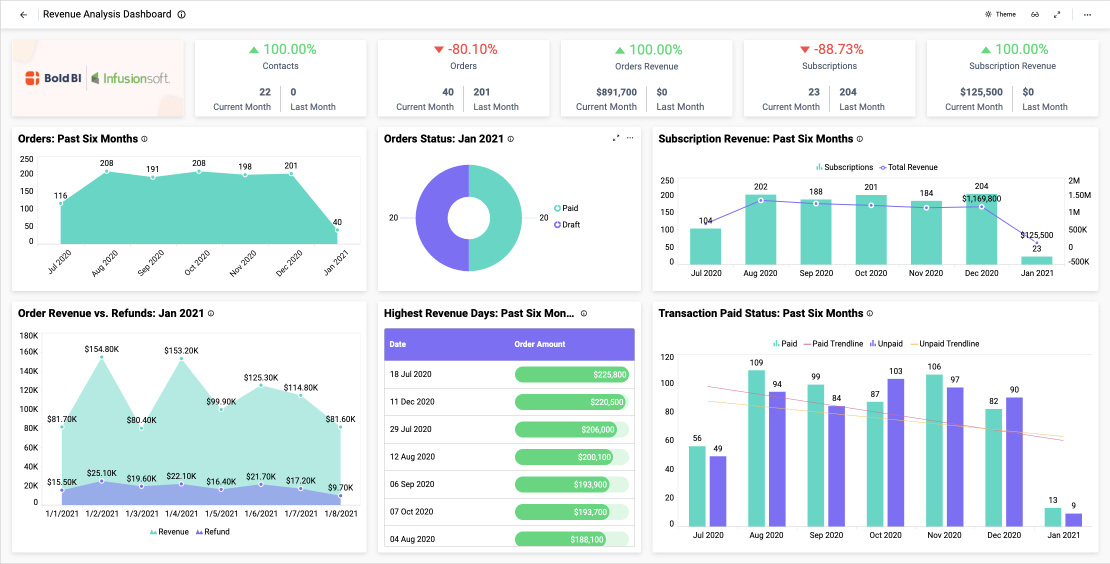
This Infusionsoft dashboard provides a detailed breakdown of a company’s recent orders.

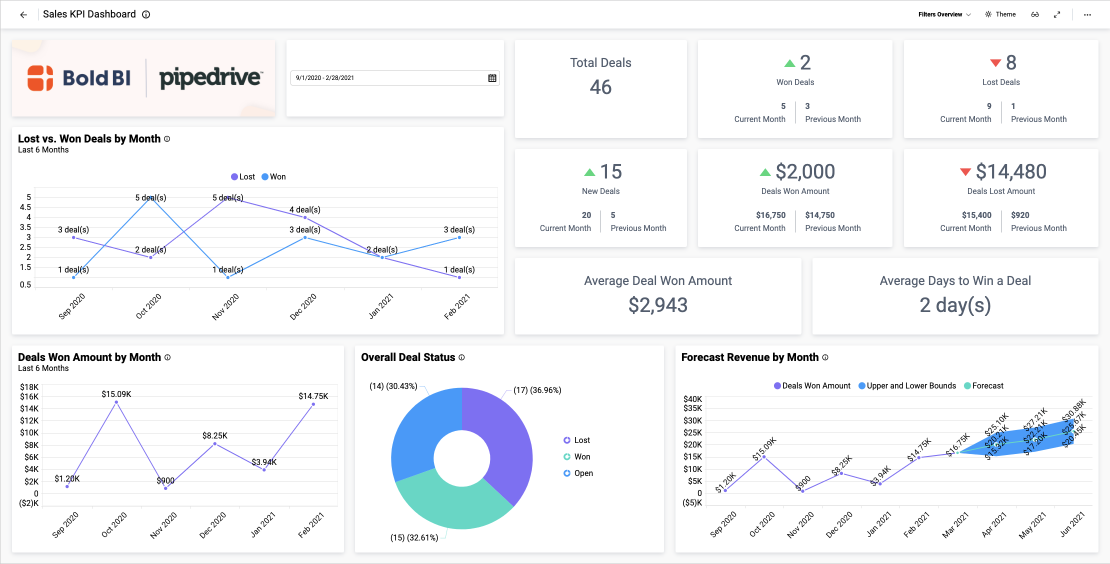
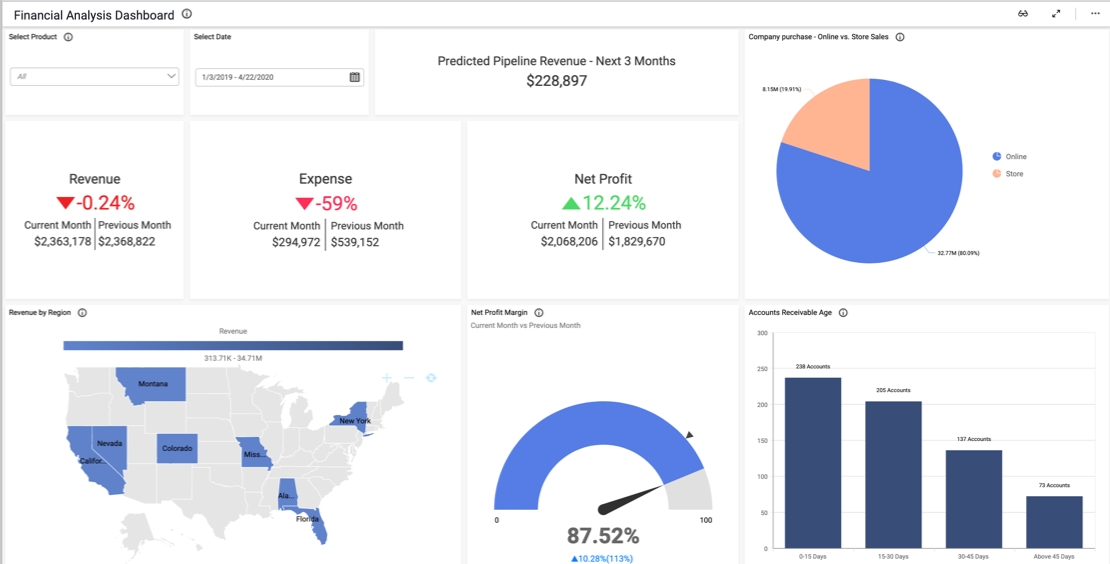
This sales KPI dashboard provides a detailed breakdown of a company’s key metrics.

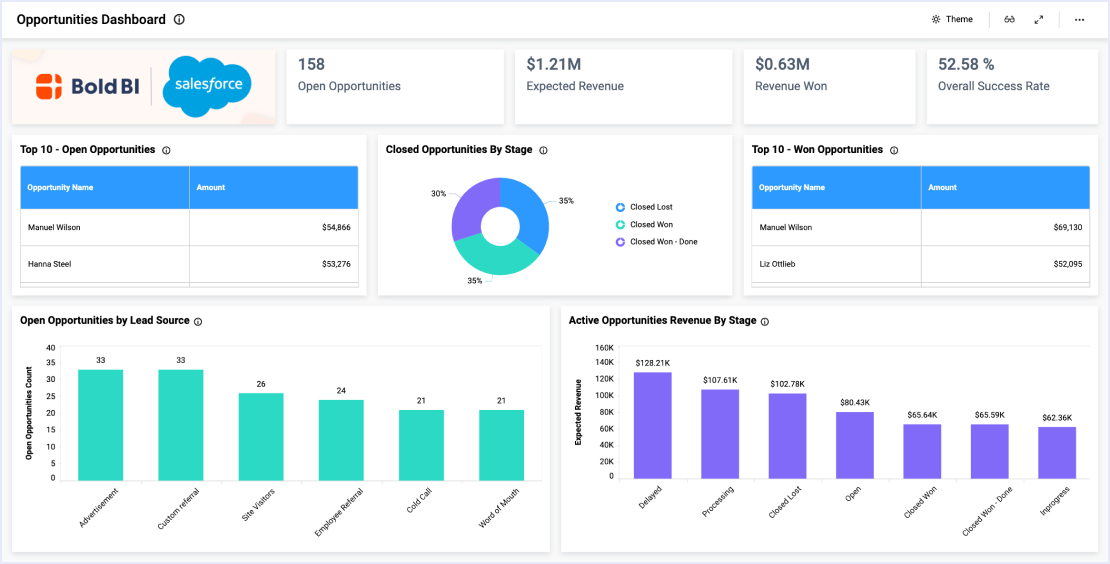
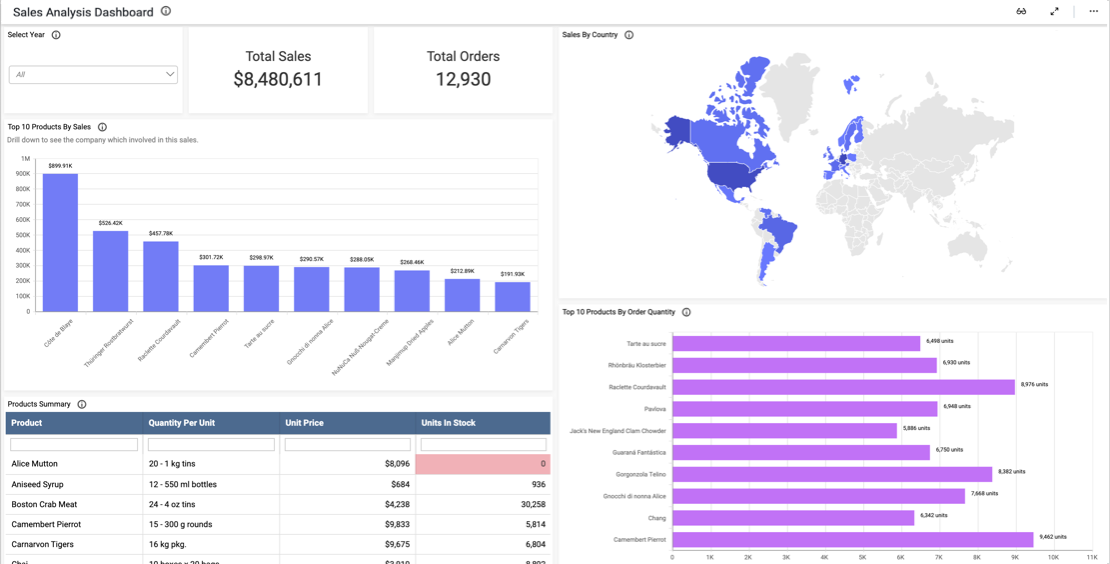
This Salesforce opportunity dashboard provides an overview of a company’s sales outlook.
This sales activity tracker dashboard displays key data sets relating to ticket sales.

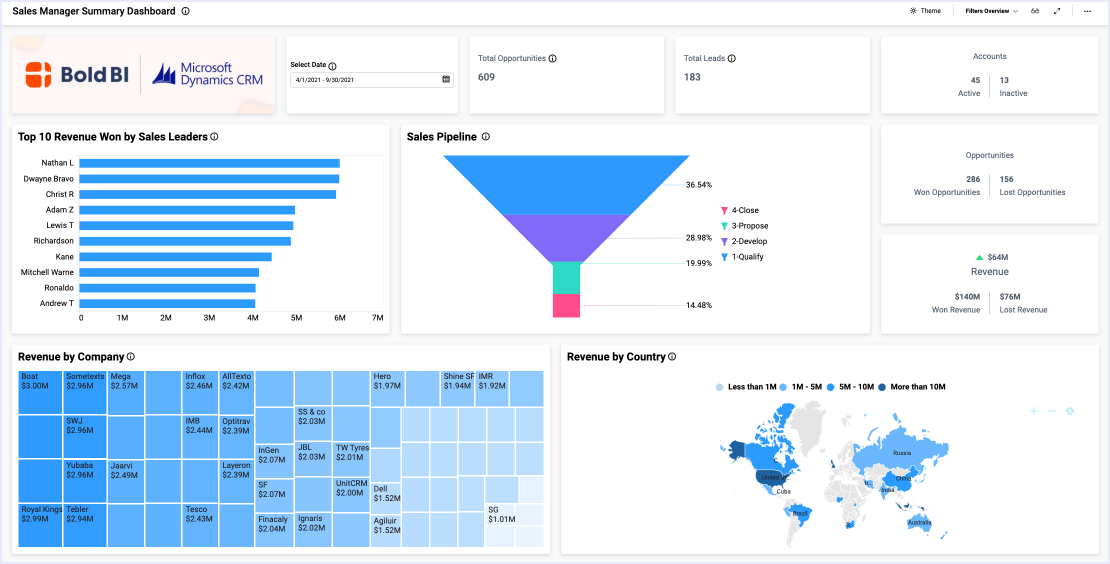
This sales manager summary dashboard provides a detailed breakdown of a company’s revenue details, leads, and sales pipeline. With this dashboard…
This sales leads tracking dashboard provides a detailed breakdown of a company’s lead and account details. With this dashboard…

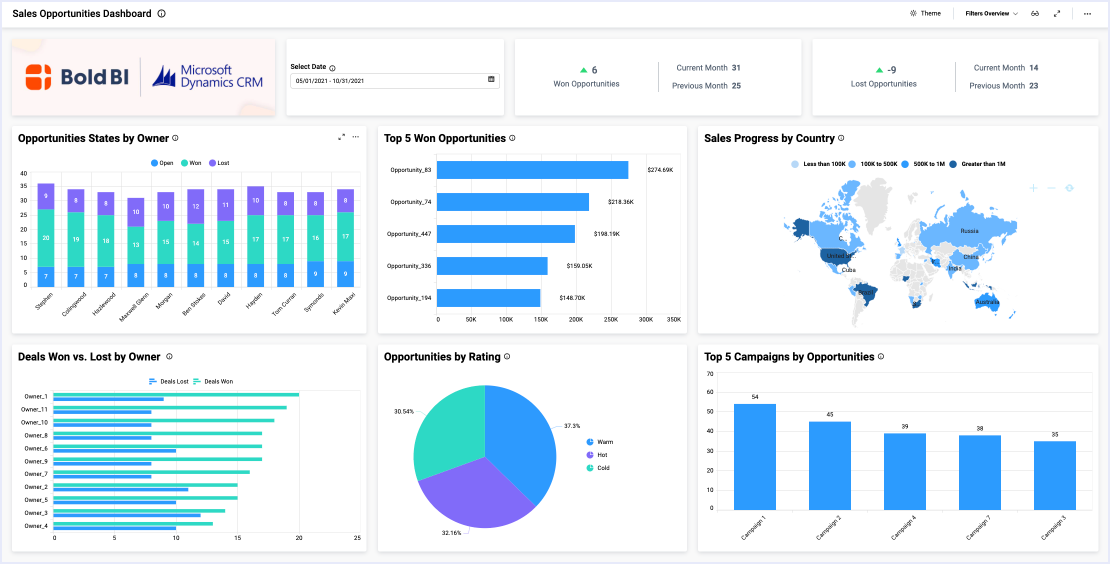
This sales opportunities dashboard provides a detailed breakdown of a company’s opportunities and revenue. With this dashboard…


This sales activities tracker dashboard provides a detailed breakdown of a sales team’s work. With this dashboard, we can answer…
View Other Solutions
In the information technology field, you need to be able to monitor everything…

